Searching geolocated tweets & Twitter maps
31 December, 2015 by Tom
The new geolocated tweet feature on Social Bearing is a great way to visualise tweets from a specific location. Instead of searching for tweets by keyword or hashtag, you select a location anywhere in the world within a defined radius and combine with optional keyword or hashtag search terms.
Important to note however that exact tweet locations have been obscured for privacy reasons
Geolocation isn’t enabled by default for Twitter accounts and approximately 1% of all tweets are geotagged. Geo based Twitter searches therefore work best for locations with a large population or large scale public events like gigs, sporting matches and other gatherings.
When you search for geo tweets, the interactive Twitter map will initially display markers for each tweet within a circle representing the radius selected. The marker colours reflect the sentiment of each tweet; green for positive, red for negative and blue for neutral. While the sentiment may not be 100% accurate for individual tweets, they usually give a good representation of overall emotional intensity and mood for crowds and larger groups of people.
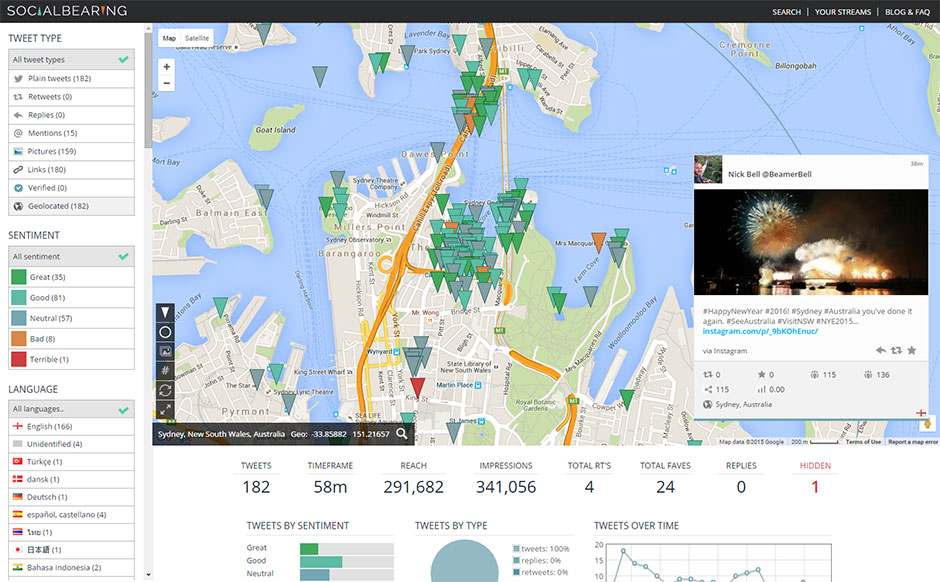
Geolocated tweets from Sydney at New Years Eve
The above example shows geolocated tweets within a 5km radius of Sydney harbor at New Years Eve. People are grouped largely around the Opera House, bridge and harbor areas and the colored markers show a very positive mood.
Selecting individual markers will show the tweet in the bottom right of the map. Markers can be dragged and dropped; useful if close together and hard to select. Zooming in on the map will also help with marker spacing.
The buttons on the left of the map toggle the display of markers, radius circle(s), hashtags and picture overlays. There’s also a fullscreen mode and ability to auto load new tweets on the map. The below images show hashtag and image overlays on the same geolocated search with the most frequent hashtags used in this area being #sydney, #fireworks and #sydnye
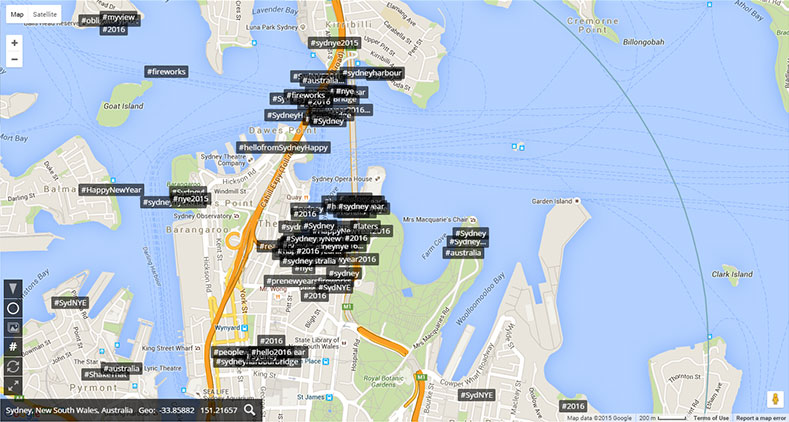
Geolocated tweets with hashtag overlay
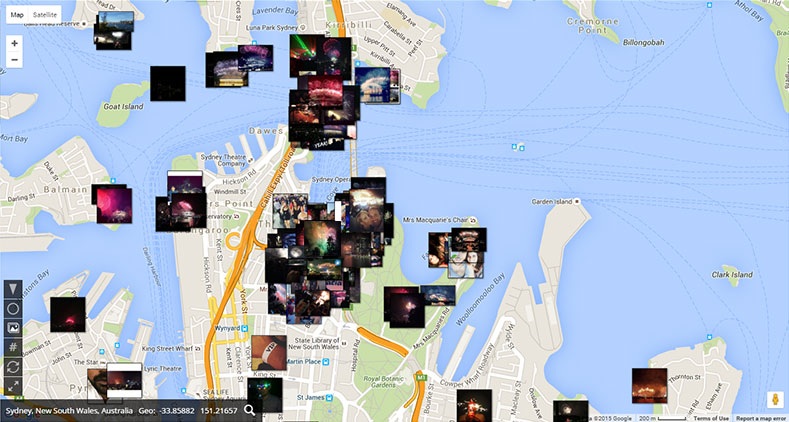
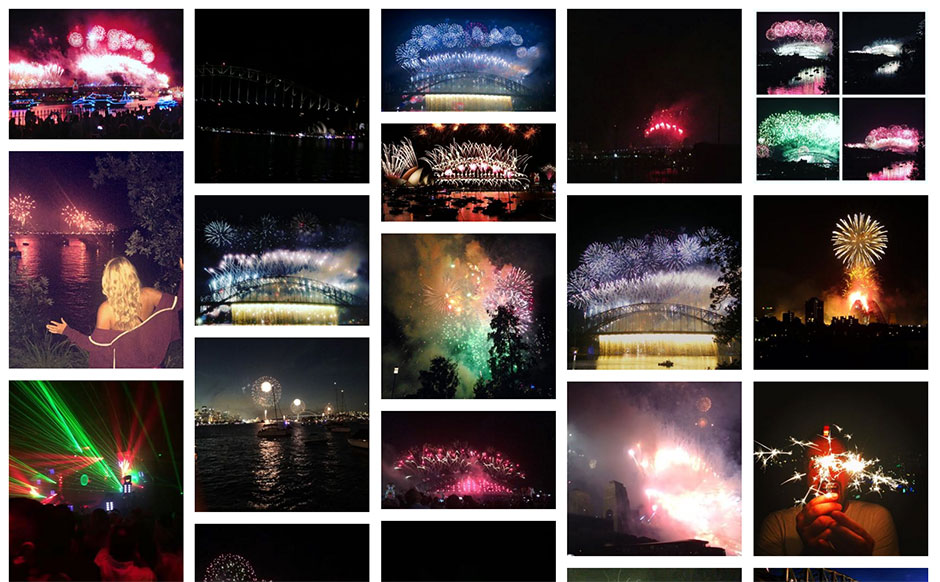
Geolocated tweets with photo overlay
In addition to the map view of tweets, the dashboard and tweet wall is displayed below in a similar way as the regular Social Bearing tweet or timeline search. The dashboard in this example shows 182 geolocated tweets in a period of 58 minutes with sentiment and tweet type breakdown, along with a tweets over time graph.
Tweet wall features include displaying tweets full screen, Twitter photo wall and options to sort and auto refresh tweets.
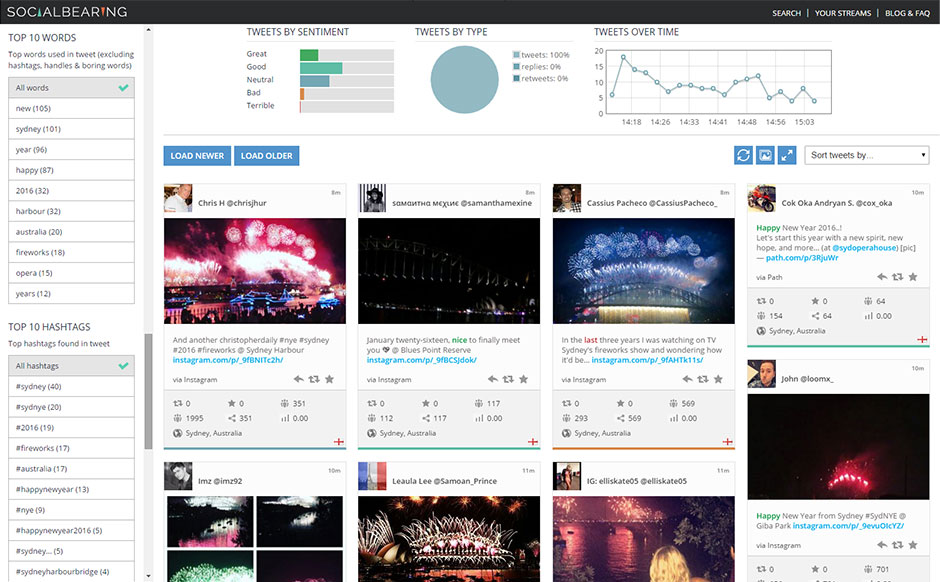
Tweet wall and dashboard for geolocated tweets
Fullscreen Tweet photo wall for geolocated tweets in Sydney at New Years Eve
The filters and information in the left sidebar allow you to view top influences and contributors in the area, display top hashtags and words used and filter both map and tweet wall by language, sentiment and tweet type.
Leave a Reply